Speaking of fall... our fall math and reading screening window is open from September 1 - 14. If this window is catching you off guard, please check out the Local Comprehensive Assessment Plan for the 2018-2019 school year by clicking on the link on the wcsu32.org website.

In this post, I address these topics:
- What is the purpose of this assessment and how does it relate to RtI (MTSS)?
- What's new this year?
- How do I begin looking at the data?
If you're looking for information about how to log in and/or administer check out the blog post linked here.
Do you have other questions? Please email to me (Ellen Dorsey) at edorsey@u32.org.
Do you have other questions? Please email to me (Ellen Dorsey) at edorsey@u32.org.
What is the purpose of this assessment and how does it relate to RtI (MTSS)?
Response to Intervention (RtI or Multi-tiered Systems of Support - MTSS in Vermont) is a systematic process for assessing student needs and creating opportunities for learning for all students. It is a three-tiered system beginning with Tier 1, which is high quality, inclusive first instruction for all students. All students receive Tier 1 core instruction and are screened regularly to look for students who might benefit from an intervention to supplement (not replace) Tier 1 instruction. Regularly, we need to monitor student progress resulting from inventions to see if they are working.
WANT MORE INFO? Here is a overview video describing the three tiers:
In WCSU, we use STAR 360 as a screener for math and reading. It tell us which students are at risk for poor learning outcomes by sorting student scores into four performance categories that are color coded (red, yellow, blue, green). Students with scores in the red and yellow categories need a closer look because existing Tier 1 instruction may need to be bolstered or supplemented with an intervention.What is new this year?
This is the third year we have been using STAR 360 in WCSU. For those of you who've been around the block a few times in WCSU... Maybe, you know the drill, you administered the test (no problem), and started checking out the results while eating lunch at your desk. Then, you nearly choked on your sandwich when you noticed:
None of my students are in the green!
Please don't panic. There is a logical explanation for this. This year, we changed the "benchmark" criteria that is used to determine the performance categories. Simply put, "green" does not mean the same thing in 2018-2019 that it did in 2017-2018.
In past years... We used national percentile rank as the means of placing a student's performance on the assessment in one of four categories. The categories were:
- Urgent Intervention (0th-9th%) - These students are at the most risk and likely require the most intensive level of intervention (highest frequency).
- Intervention (10th-24th%) - These students are at risk and likely require some intervention.
- On Watch (25th-49th %) - These students may have some risk and require monitoring.
- At or Above (50th-100th%) - These students are not at risk.
One issue with those criteria was that the categories were not well aligned with the four categories of mastery measured by the Smarter Balanced Assessment. In other words, a student could be a "green" on the assessment and get a "2" on the Smarter Balanced Assessment. This was confusing for students, caregivers, and teachers.
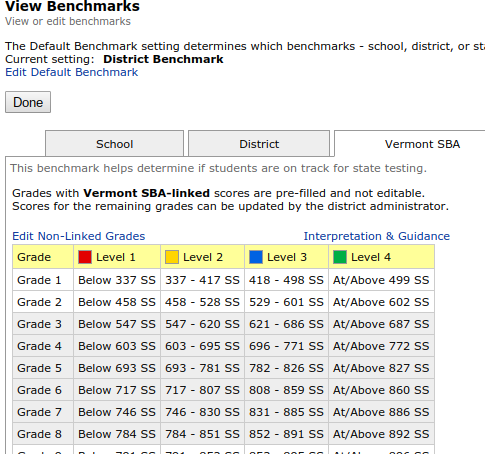
This year... We are using the "Vermont SBA" criteria that are determined using scaled scores that are intended to align with the Smarter Balanced Assessment Mastery Scale (see table below).
- Urgent Intervention (0th-9th%) - These students are at the most risk and likely require the most intensive level of intervention (highest frequency).
- Intervention (10th-24th%) - These students are at risk and likely require some intervention.
- On Watch (25th-49th %) - These students may have some risk and require monitoring.
- At or Above (50th-100th%) - These students are not at risk.
One issue with those criteria was that the categories were not well aligned with the four categories of mastery measured by the Smarter Balanced Assessment. In other words, a student could be a "green" on the assessment and get a "2" on the Smarter Balanced Assessment. This was confusing for students, caregivers, and teachers.
This year... We are using the "Vermont SBA" criteria that are determined using scaled scores that are intended to align with the Smarter Balanced Assessment Mastery Scale (see table below).
Now the categories are:
Now the categories are:
- Does not meet the achievement standard (Level 1) - These students are at the most risk and likely require intervention.
- Nearly meets the achievement standards (Level 2) - These students require monitoring and may require some intervention.
- Meets the achievement standards (Level 3) - These students are not at risk.
- Exceeds the achievement standards (Level 4) - These students are not at risk.
The visual below shows how the old and new category criteria relate. You can click on the image to see it in a Google doc.

How do I begin looking at the data?
Once your students have taken a STAR assessment, there are various reports that are helpful for taking a closer look at the data. The four reports I'd like to highlight in this post are: Screening, Diagnostic, State Standards, and Instructional Planning. Here's a description of what they are and how to access and use them.
Screening Report
The first report you will want to look at after a screening window is the Screening report. How to find it:
- Start at the Home screen.
- Click on either Reading Assessments or Math Assessments.
- Select "Reports."
- Select "Screening."
- Click on the class you want to look at.
- Click on the categories you want to look at (Level 4, Level 3, Level 2, Level 1, and/or Students Not Tested).
- Generate the report.
Use this report to find out what students need a closer look. Plan on looking at all of your students who are not "At or Above" using the other reports.
DID YOU FIND OUT SOME OF YOUR STUDENTS MISSED THE TEST? No problem! Even though the window is closed, you can still have them take a test. They will not be included in the Screening report for this window, but you can still see their scaled score and percentile rank relating to their test date and use this information to respond. Likewise, you can still run Diagnostic, Instructional Planning and Growth reports on those after they have taken the test.
Diagnostic Report
The Diagnostic report breaks down each student's scaled score into content domains and skill areas within those domains showing the student's percent mastery of various grade-level skills (assuming 100% would be at the end of the grade level). This report is helpful in finding a student's relative strengths and weaknesses. It is also useful to notice trends among students that can inform Tier 1 instruction.
For example, last year we noticed that geometry was a relative weakness for our students in grades 3-5, so we made the decision to switch around our scope and sequence for math, addressing some geometry skills at various points earlier in the year.
How to find it:
- Start at the Home screen.
- Click on either Reading Assessments or Math Assessments.
- Select "Reports."
- Select "Diagnostic."
- Click on the class you want to look at.
- Click "No" you don't want to look at the grade equivalent (because this is based on percentiles, not standards).
- Click "Yes" you do want to see skill area scores.
- Generate the report.
Still having trouble? Here is a video showing you how to access this report.
NOTE: This is a good report to share with students and/or parents (make sure you do not show the grade equivalent though!). It could help them to see their relative strengths and weaknesses and how weaknesses will be addressed through the scope and sequence at their grade-level and any interventions the student may have.
BEWARE: This report is replaced every time a student takes an assessment. So if you want to be able to refer back to it later (for example, to look at growth in a skill area) you will need to save this file. I recommend saving it with the date in the filename.
State Standards - Class and Student Reports
The State Standards reports are my favorites.So, you've checked out your students' performance in the various CCSS domains on the Diagnostic report and are thinking:
I really wish I could see my students' performance broken down by Common Core Standard.If that's the case, the State Standards reports is going to be your jam.
The State Standards - Class report is broken down by Common Core Standard shows you a list of students in your class in each of three categories of estimated mastery (Above, Within, and Below) for that standard. Check it out:
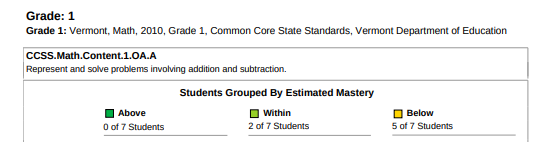
PLEASE NOTE: There are three categories because levels 1 and 2 are combined (think of this as red and yellow). Level 3 is light green and Level 4 is dark green. Personally, I would have gone with orange, blue, and green as the colors, but they didn't ask me.

Each vertical bar represents one standard. The black horizontal line shows the student's current estimate of mastery. The light blue horizontal line shows the student's projected growth at the end of the year. The varying lengths of the mastery bands
This report is helpful in finding a student's relative strengths and weaknesses. It is also useful to notice trends among students that can inform Tier 1 instruction.
How to find it:
- Start at the Home screen.
- Click on either Reading Assessments or Math Assessments.
- Select "Reports"
- Scroll down to Select "State Standards - Class" or "States Standards - Student"
- Click on the class or individual students you want to look at.
- Make sure the date you input for the Reporting Period isn't more than 30 days later than the most recent test.
- Pick certain standards you want to look at or (as a default) look at them all.
- Click "No" you don't want to look at the grade equivalent (because this is based on percentiles, not standards).
- Generate the report.
Instructional Planning - Student Report
The Instructional Planning - Student report shows you the skills that each student is ready to learn. I would recommend running this report on all students who are flagged as needing some sort of intervention. Use this to find potential focus skills for interventions (suggested focus skills are highlighted with double arrows).
How to find it:
- Start at the Home screen.
- Click on either Reading Assessments or Math Assessments.
- Select "Reports."
- Select "Instructional Planning - Student."
- Click on the class or individual students you want to look at.
- Click "No" you don't want to look at the grade equivalent (because this is based on percentiles, not standards).
- Generate the report.
Still having trouble? Here is a video showing you how to access this report.
BEWARE: This report is replaced every time a student takes an assessment. So if you want to be able to refer back to it later you will need to save this file. I recommend saving it with the date in the filename.
No comments:
Post a Comment